Lower PUE. Lower WUE. More usable capacity. More trust.

We measure. We integrate. We optimize. From data to uptime — and to margin.

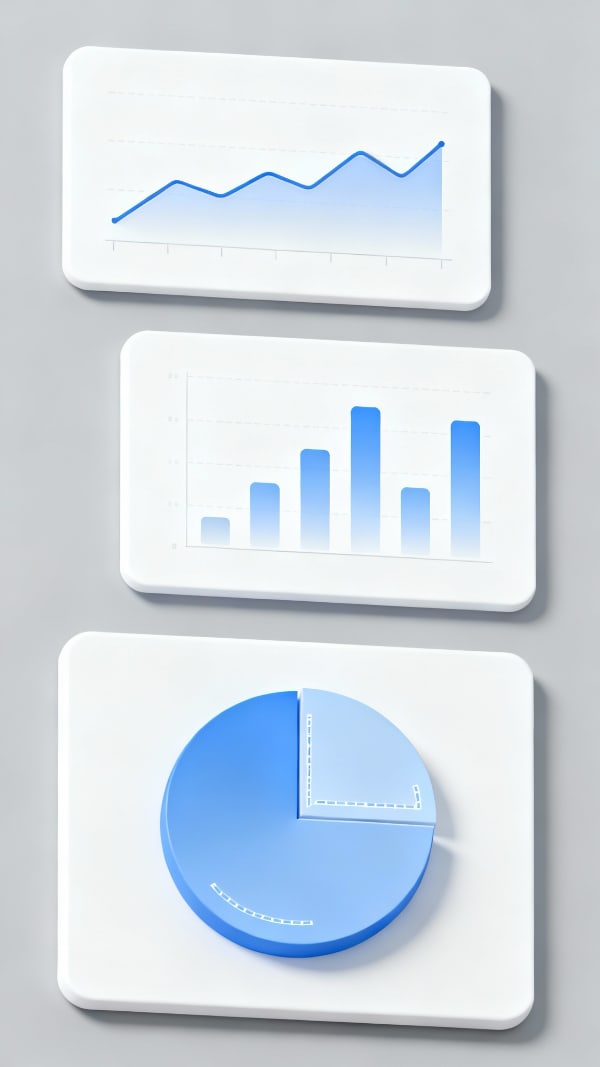
PUE ↓ and kWh/IT ↑ (released capacity)

Water under control (WUE ↓) and lower thermal risk

ESG reporting and dashboards for clients/tenants

Rolling 30d PUE: 1.47 · WUE: 0.9 L/kWh IT · SLA: 99.999%

Trusted by operators, hyperscalers, and certified by

Equinix
Digital Realty
Uptime Institute
ISO 50001

DCIM + IoT, but actionable.

We connect your DCIM/BMS/IT systems, define KPIs (PUE/WUE/CUE/thermal), and automate alerts, reporting, and communication for clients and investors.

Sources

DCIM, BMS, EMS, CRAC/CRAH, chillers, UPS, PDUs...

Data Quality

Normalization, validation, time sync

KPIs & Alerts

DC library, dynamic thresholds

Optimization

Setpoints, airflow, load balancing

Reporting

ESG/CSRD, client/tenant portal

Granular telemetry. Instant action.

What we measure, how we integrate, how we act.

Energy

  • • IT load vs. facility load
  • • Peaks, PF, UPS losses

Cooling

  • • CRAC/CRAH, chillers, towers
  • • ΔT, COP, free cooling

Air

  • • Hot/cold aisle containment
  • • Pressure, bypass, hotspots

Water

  • • Make-up, blowdown, WUE
  • • Leaks, irrigation/adiabatic

Critical Assets

  • • UPS/STS/Gensets, batteries
  • • MTTF/MTTR

Network & IT

  • • Utilization, ports, latency
  • • SNMP/flow

Capacity

  • • Power/space/cooling
  • • Stranded capacity

Carbon

  • • Grid hourly intensity
  • • PPAs/renewables, CFE

[DEMO] Low ΔT in Room 2 · CRAC #07 efficiency degraded · Ticket created (CMMS).

Compatible Sources

Protocols: BACnet/Modbus/MQTT, SNMP, IPMI, Redfish, OPC-UA

DCIM: Nlyte, Sunbird, EcoStruxure...

BMS: Siemens, Honeywell...

KPIs that move the needle.

Clear definitions for operations, ESG, and client communication.

Indicator Definition Short Formula Impact
PUE Total E. / IT E. Facility / IT Efficiency & cost
WUE (L/kWh IT) Water per kWh IT Total L / kWh IT Water & risk
CUE (kg/kWh IT) CO₂e per kWh IT Emissions / kWh IT ESG/CSRD
ΔT supply-return Cooling efficiency T_return − T_supply Hotspots, COP
UPS loss (%) Conversion losses 1 − η UPS Energy & thermal
kW/rack Effective density kW IT / rack Planning
Stranded capacity Unused capacity CapInstalled − CapUsable ROI, CapEx
SLAs (uptime) Level by room/tenant % monthly/yearly Contracts

Technical mode and “client mode” (plain explanation).

Frictionless ESG — no scattered spreadsheets.

Ensure compliance, traceability, and credible ESG storytelling for investors.

Key Features:

  • CSRD, GHG Protocol, EU Taxonomy (eligibility/alignment)
  • Scope 1–2–3 and hourly CFE (carbon-free energy) tracking
  • Energy & Water stewardship with auditable metrics
  • Evidence and data custody for audit readiness

Frameworks Covered

CSRD/ESRS
GHG Protocol
EU Taxonomy
SDGs

Certifications earned through operational data.

Guide improvement and speak the industry’s language.

Uptime Institute
ISO 50001
ENERGY STAR DC
LEED/BREEAM
CEEDA

Gap by Pillar

Pillar Status Action Impact
Energy 68% Optimize setpoints + UPS ECO mode High
Cooling 58% Improve containment + balance High
Water 72% Optimize adiabatic system Medium
Ops 80% DR tests & runbooks Medium

Operations that protect both SLA and margin.

Show daily improvements, savings, and risk reduction.

Power

UPS ECO mode, PF, peaks.

-2–4% electrical losses

Cooling

Setpoints, airflow, free cooling.

-10–25% HVAC kWh

White space

H/C containment, sealing, lower bypass.

Fewer hotspots

Water

WUE, leaks, blowdowns.

-10–30% water use

Capacity

Right-sizing, freed-up capacity.

Deferred CapEx

Maintenance

Predictive CRAC/UPS.

Lower MTTR

DR & Grid

Demand response / hourly CO₂.

Reduced emissions

Tenant Care

Client views.

Fewer tickets, higher trust

One standard for all your sites.

Corporate visibility, benchmarking, and scalability.

Key Features:

  • Benchmark by site/region/climate (PUE/WUE/CUE, kW/rack)
  • Top-down targets and bottom-up plans with replicable best practices
  • Climate models: goals by ambient temperature/humidity
  • Unified reporting for Board and investors

Site Ranking

Top by PUE: Site A (1.31)

Bottom by PUE: Site C (1.52)

Top by WUE: Site B (0.7 L/kWh)

Bottom by WUE: Site A (1.1 L/kWh)

Real savings. Lower risks. Released capacity.

Clear numbers — energy, water, CapEx, risk.

Energy

-10–25% HVAC

Water

-10–30% WUE

Capacity

Deferred CapEx

Risk

MTTR ↓, SLA protected

Revenue

Higher tenant NPS

Illustrative Business Case

Scenario: IT load 5 MW (24/7)

• PUE 1.60 → 1.45 ⇒ 0.75 MW saved

• Annual savings: 6,570 MWh (€788,400/year at €0.12/kWh)

• WUE 1.4 → 0.8 ⇒ 26,280 m³ saved

• CO₂ avoided: 1,642 tCO₂e

Payback ≈ 1.5 years (on €1.2M investment)

DC ROI Calculator

Annual Savings

€788,400

Payback: 1.5 years | tCO₂e avoided: 1,642

Smart transparency — for the people who matter.

Show results — without revealing sensitive data.

Key Features:

  • Executive dashboards (Board/Finance) and operational (NOC/Facilities)
  • Client/Tenant portal: room/rack/contract views (local PUE, SLAs, tickets, changes)
  • Export to PDF/Excel/PowerPoint and “data stories” (before/after)
  • CFE/Renewables: hourly tracking and verifiable claims
  • Public mode (optional): ESG highlights without sensitive data

Dashboard Mockup

PUE

1.45

WUE

0.8

CUE

0.21

SLAs

100%

Monthly Trend Line Chart

Status: All systems normal

We connect to your DCIM, BMS, and IT systems.

Seamless fit with your DC stack.

DCIM: Nlyte, Sunbird, EcoStruxure... BMS/EMS: Siemens, Honeywell, Schneider... IT/Network: SNMP, NetFlow, CMDB... Hardware: UPS, PDUs, CRACs... Back-office: CMMS, ERPs, SSO...

Open API, webhooks, queues/retries, schema validation, time-series DB, configurable data retention.